
Roshan Deolasi
Power BI Analyst | Business Intelligence | MIS & Reporting Analytics | Process & Operations
About Me
I am a Power BI Analyst with 3 years of hands-on dashboard and MIS reporting experience, backed by 10 years of operations and client delivery at eClerx Services and HERE Technologies.Over the years I realized that most operational challenges are actually reporting and visibility problems. Decision-makers struggle when they lack clear KPIs, accurate tracking, and actionable insights presented at the right time. That realization led me into Business Intelligence and reporting analytics.I work with Power BI, DAX, Power Query, SQL, Excel, and data visualisation to build dashboards focused on operational reporting, KPI tracking, workforce analytics, and business insights. Every project in this portfolio was developed end-to-end - from identifying the business problem and defining metrics to designing the final dashboard experience.What differentiates me from most BI candidates is my operational background. I understand how reports are actually consumed by managers, clients, and leadership teams - because I spent years presenting performance data in real delivery environments where reporting directly drove decisions and outcomes.📍 Location: Mumbai · Hybrid · Remote
🔍 Open to: Power Bi Analyst · Reporting Analyst · MIS Analyst
BI and Data Analyst roles
Skills

Excel | Power BI | SQL
DAX · Power Query · Pivot Tables · Data Modeling · ETL
Data Visualization
Business Analytics
Project Management
KPI Reporting
Team Management
Stakeholder Collaboration
Process Improvement
Client Communication
Featured Projects
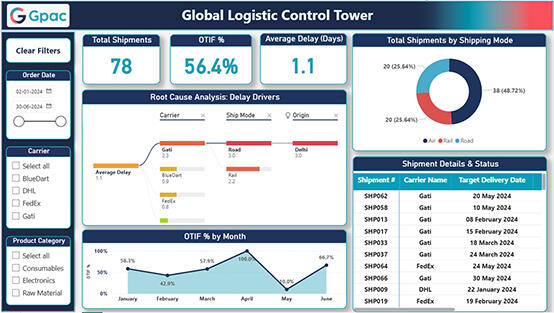
Global Logistics Control Tower
A strategic dashboard designed to optimize delivery performance and logistics visibility.

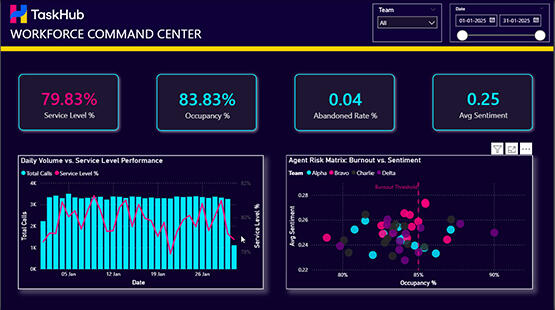
Workforce Command Center
A BPO Command Center dashboard balancing Client SLAs and Employee Health using a Risk Matrix to detect burnout and reduce attrition
Claims Fraud Risk Monitor
A Power BI executive dashboard designed to detect insurance fraud and reduce financial risk.

Certifications & Recognition
Global Logistics Control Tower
STRATEGIC DASHBOARD | SUPPLY CHAIN OPTIMIZATION

Key Features:
The Challenge:
To provide real-time visibility into global shipping operations and identify root causes behind delivery delays and falling OTIF (On-Time In-Full) scores.The Solution:
A dynamic Power BI "Control Tower" that tracks shipment volumes and carrier performance. It enables stakeholders to drill down from high-level KPIs to specific granular bottlenecks in seconds.
Root Cause AI: Uses Decomposition Trees to automatically detect which carriers, routes, or regions are driving delays.
Performance Tracking: Monitors OTIF % and Average Delay days to benchmark carrier reliability.
Smart Alerts: Conditional formatting highlights "At Risk" shipments for immediate action.
The Impact:
Enables logistics managers to identify delay root causes in seconds rather than hours, improving carrier accountability and delivery planning
POWER BI • DAX • AI VISUALS
TaskHub Workforce Command Center
STRATEGIC DASHBOARD | SUPPLY CHAIN OPTIMIZATION
The Business Problem:
BPO managers constantly struggle to balance aggressive Client SLAs with employee well-being. Overworking agents drives attrition, while underworking them causes missed targets. The goal was to build a visual tool that helps managers align performance goals with retention needs to prevent burnout.The Solution:
Developed the "Workforce Command Center," a dashboard that correlates operational KPIs with agent sentiment. Instead of just tracking past performance, the tool provides proactive insights, specifically identifying agents at high risk of burnout to support retention strategies.
Key Features:
Agent Risk Matrix (Scatter Plot): A custom quadrant analysis plotting Occupancy % against Sentiment Score. This instantly flags "At-Risk" agents who are overworked (>85% Occupancy) and unhappy, allowing managers to intervene before attrition occurs.
Volume vs. SLA Trend: A chart visualizing the direct correlation between daily call spikes and Service Level drops, proving the need for better workforce planning during peaks.
Dynamic Alert System: Implemented DAX with conditional formatting to trigger Neon Pink alerts when KPIs (like Abandon Rate or SLA) breach critical thresholds.
"Dark Mode" UI: Designed a modern, high-contrast aesthetic inspired by TaskUs branding, optimized for large "Command Center" screens used on operations floors.
The Impact: This dashboard empowers Operations Managers to shift from reactive "fire-fighting" to proactive "people management," potentially reducing agent attrition by identifying burnout signals early.
DAX · Power Query · Scatter Plot · Conditional Formatting
Claims Fraud Risk Monitor
RISK ANALYTICS | FRAUD DETECTION SYSTEM

The Challenge:
To reduce financial losses caused by insurance fraud. The goal was to help analysts move away from manual checks and quickly spot suspicious claims based on patterns that lead to incorrect payouts.The Solution:
A risk monitoring dashboard that segments claims into "High Risk" vs "Normal." It visualizes historical fraud patterns (like specific age groups or incident types) so the team can prioritize which claims to investigate first.
Key Features:
AI Root Cause Analysis: Uses the "Key Influencers" AI to statistically determine which factors (e.g., Age < 25) drive fraud probability.
Risk Segmentation: Dynamically categorizes claims into "High Risk" vs "Normal" status using DAX logic.
Financial Impact: Tracks critical KPIs like Loss Ratio and Total Risk Exposure in real-time.
The Impact:
Helps insurance analysts prioritize high-risk claims for investigation, reducing manual review time and improving fraud detection accuracy.
POWER BI • DAX • AI VISUALS
Professional Certifications
Certified in data analysis, business analysis, and agile methodologies - committed to continuous learning and professional development.
Corporate Recognition & Awards
12 corporate recognitions across two tenures at eClerx Services Limited — spanning Senior Analyst, Associate Process Manager, and Process Manager roles. Recognized consistently for individual performance, team leadership, process improvement, and client delivery excellence. Awarded at Director, Senior Manager, and peer level.